


Remote Sens. 2023, 15(17), 4314; https://doi.org/10.3390/rs15174314 (registering DOI) - 01 Sep 2023
Abstract
Ground-based microwave radiometer (GMWR) data with high spatial and temporal resolution can improve the accuracy of weather forecasts when effectively assimilated into numerical weather prediction. Nowadays, the major method to assimilate these data is via indirect assimilation by assimilating the retrieved profiles, which
[...] Read more.
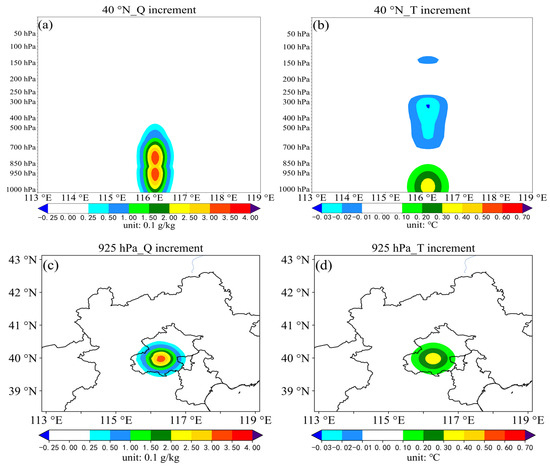
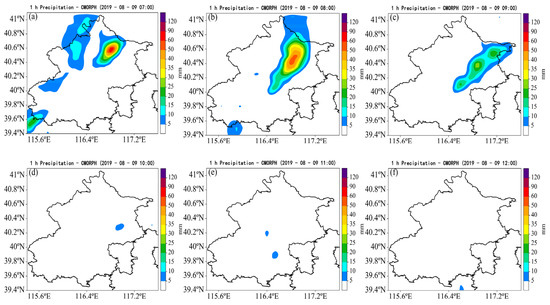
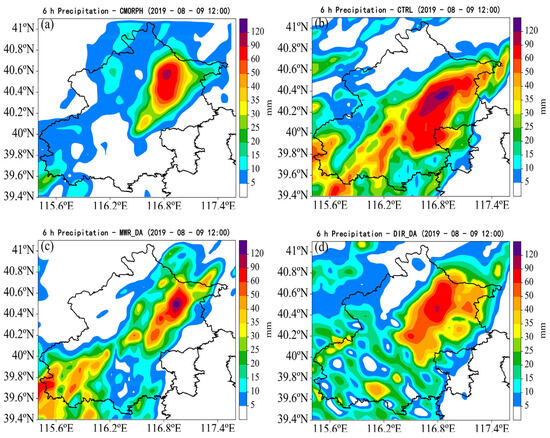
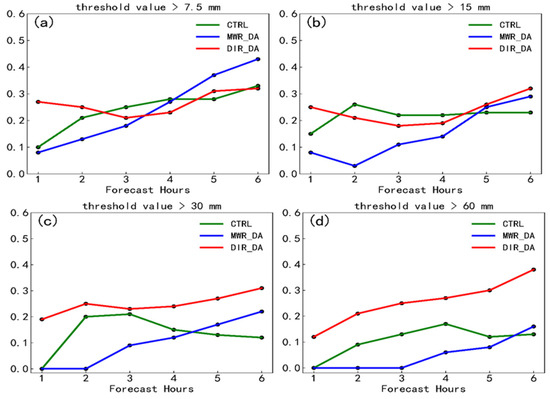
Ground-based microwave radiometer (GMWR) data with high spatial and temporal resolution can improve the accuracy of weather forecasts when effectively assimilated into numerical weather prediction. Nowadays, the major method to assimilate these data is via indirect assimilation by assimilating the retrieved profiles, which introduces large retrieval errors and cannot easily be represented by an error covariance matrix. Direct assimilation, on the other hand, can avoid this issue. In this study, the ground-based version of the Radiative Transfer for the TIROS Operational Vertical Sounder (RTTOV-gb) was selected as the observation operator, and a direct assimilation module for GMWR radiance data was established in the Weather Research and Forecasting Model Data Assimilation (WRFDA). Then, this direct assimilation module was applied to assimilate GMWR data. The results were compared to the indirect assimilation experiment and demonstrated that direct assimilation can more effectively improve the model’s initial fields in terms of temperature and humidity than indirect assimilation while avoiding the influence of retrieval errors. In addition, direct assimilation performed better in the precipitation forecast than indirect assimilation, making the main precipitation center closer to the observation. In particular, the improvement in the precipitation forecast with a threshold of 60 mm/6 h was obvious, and the corresponding TS score was significantly enhanced.
Full article
(This article belongs to the Special Issue Remote Sensing Data Application, Data Reanalysis and Advances for Mesoscale Numerical Weather Models)
►
Show Figures
Figure 1


